
Dashboard
The dashboard shows how the floor has been doing: what got finished, how long it took, how each station and operator did against the routing, and what’s late now. Admins and managers can open it from Reports → Dashboard. Everything on it is worked out from the start, stop, and complete taps on the tablets, so there’s nothing to fill in.
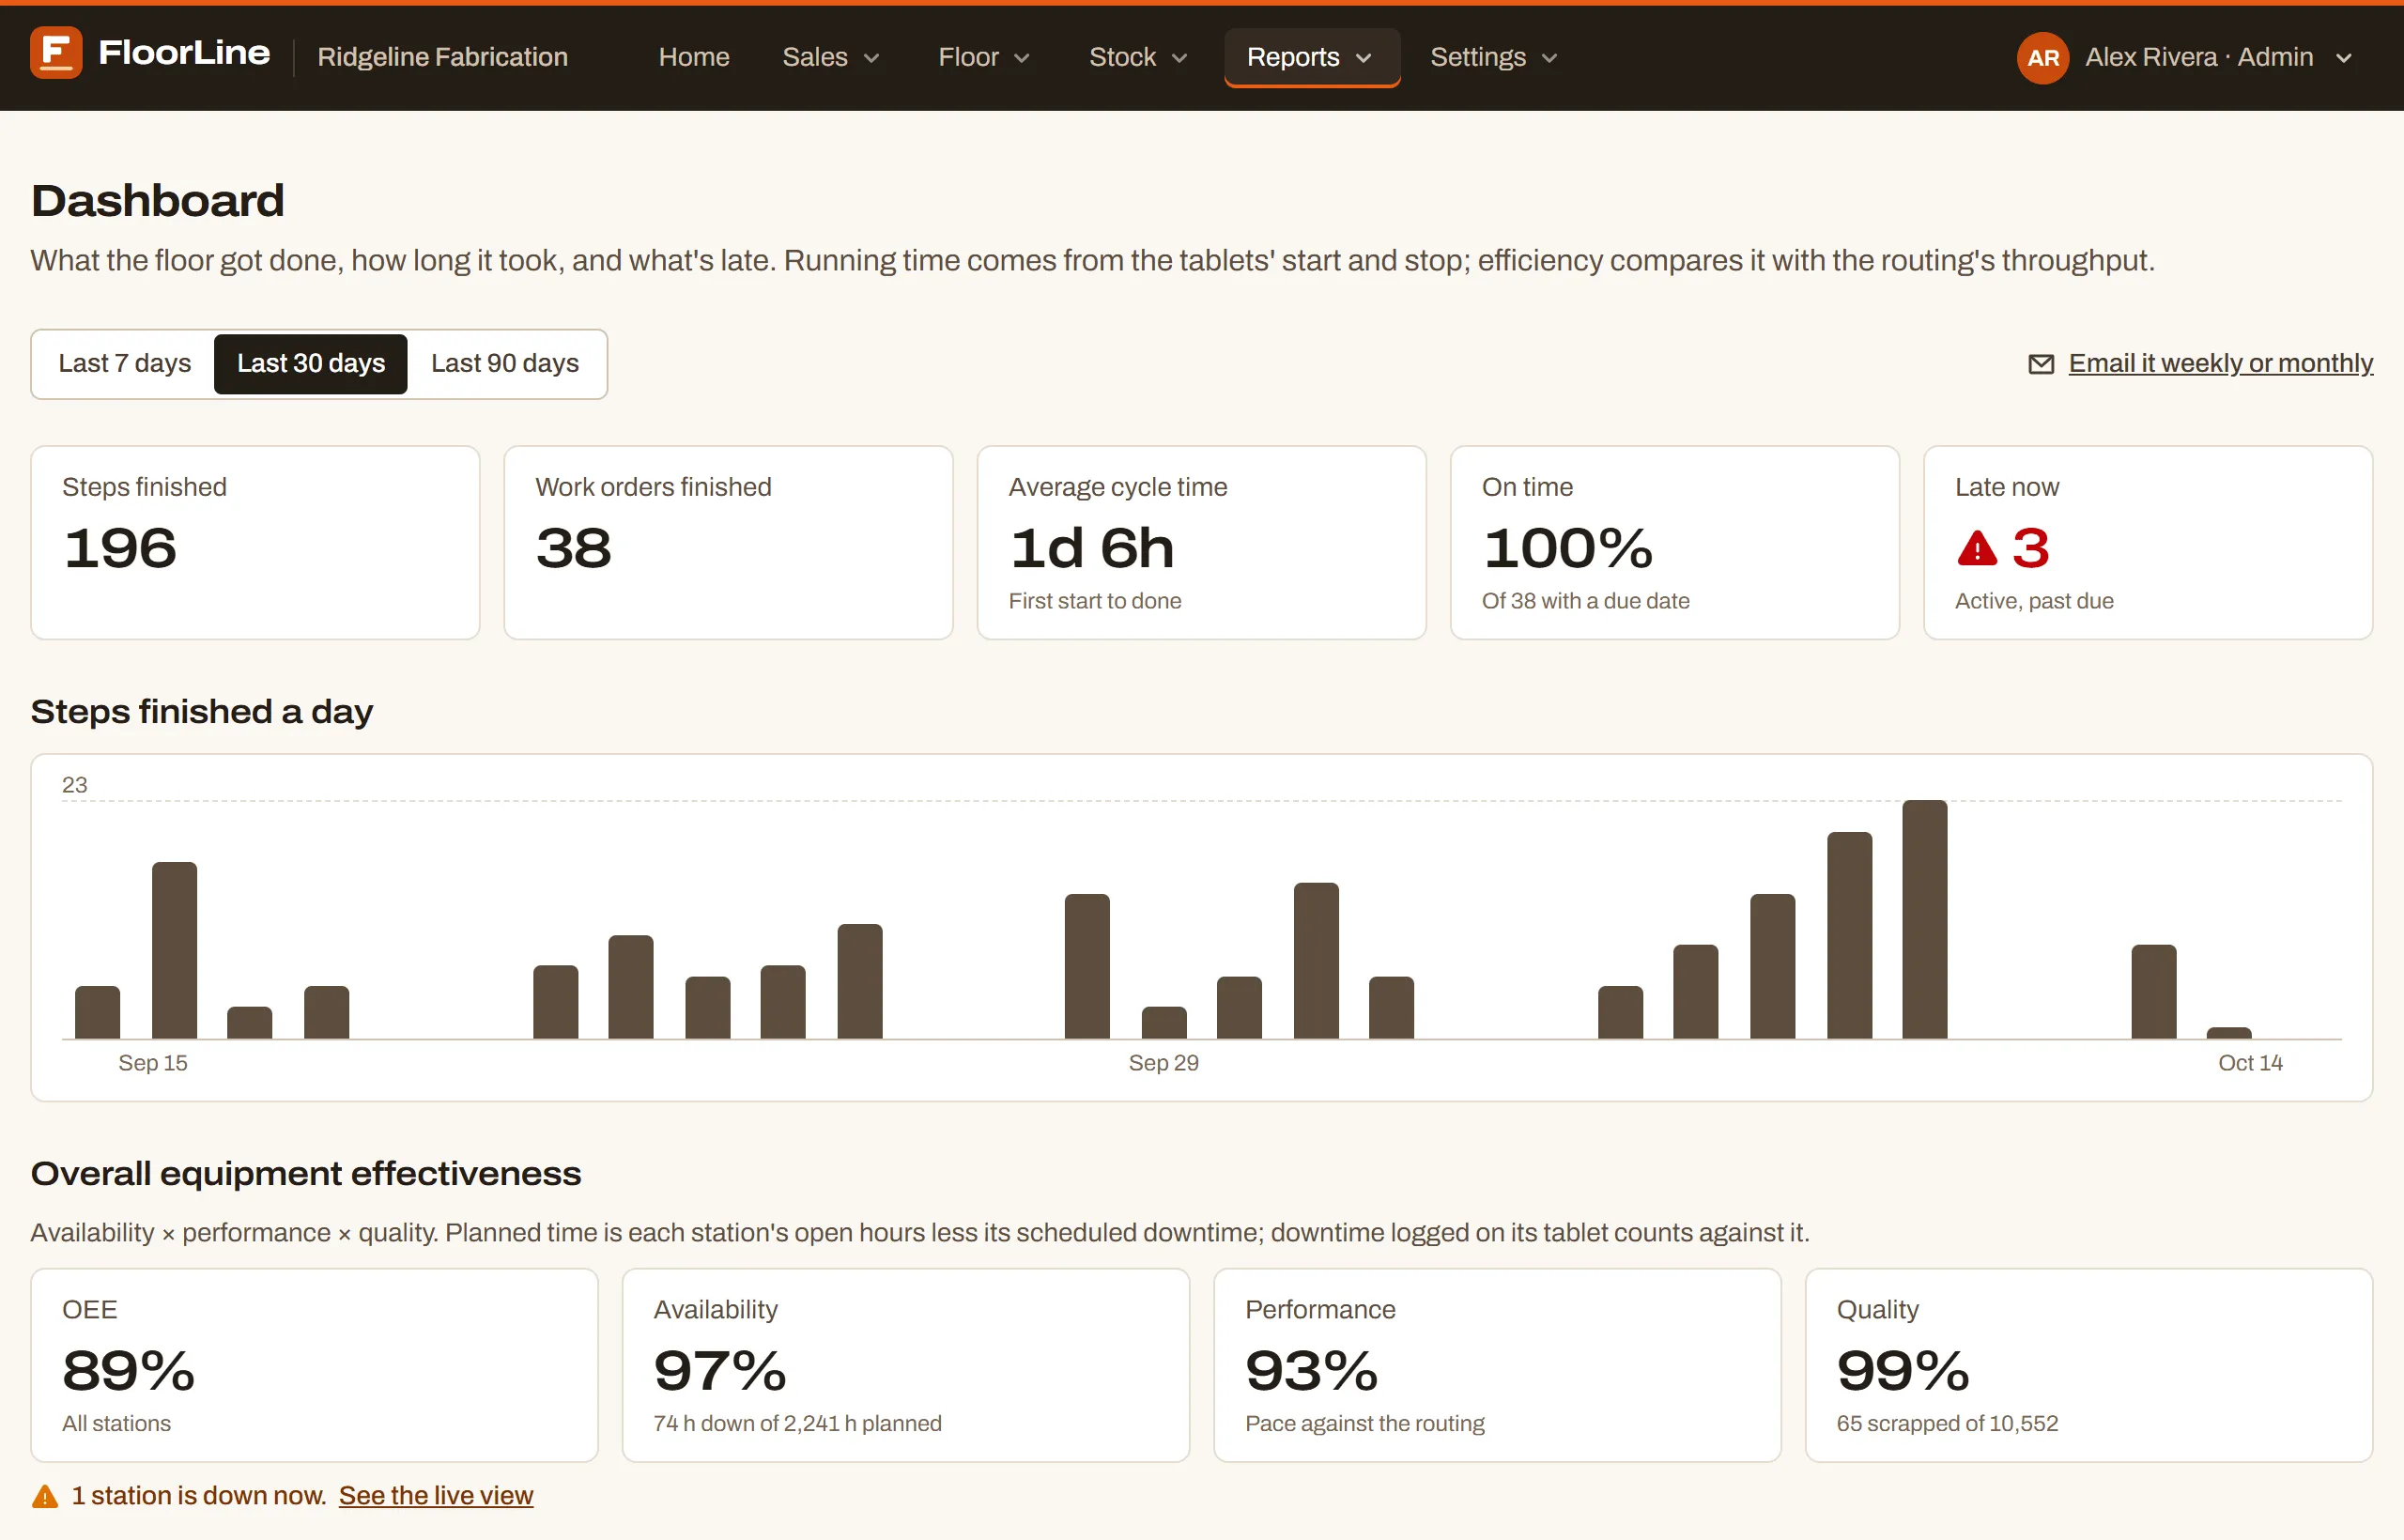
Pick a period
Section titled “Pick a period”Choose Last 7 days, Last 30 days (the default), or Last 90 days at the top. The period starts at midnight, shop time, on its first day and runs to now. It applies to everything on the page except Late now, which is always as of right now.
The page updates on its own about once a minute. While another period loads, the last one stays on screen, dimmed.
The tiles
Section titled “The tiles”| Tile | What it shows |
|---|---|
| Steps finished | Routing steps completed in the period. |
| Work orders finished | Work orders completed in the period. |
| Average cycle time | For those orders, the average time from the first start on the floor to done (“First start to done”). |
| On time | Of the finished orders that had a due date, the share finished by it. The note says how many had a due date, or “No due dates”. |
| Late now | Active work orders past their due date right now. Red when there are any. |
At the bottom of the page, Average lead time (entered to done) is the average time from when an order was entered to when it was done, with the period’s first day.
Steps finished a day
Section titled “Steps finished a day”A column chart with one bar per day of the period. Hover over a bar, or move to it with the keyboard, to see the day and how many steps were finished. The number at the top left is the busiest day’s count.
By station
Section titled “By station”One row per station that finished steps in the period:
- Steps: steps completed there.
- Units: the total quantity of the work orders those steps were for, with a bar to compare stations.
- Running: how long those steps actually ran.
- Efficiency: the routing’s estimated time compared with the actual running time (see below). A dash means none of its steps had a throughput.
By operator
Section titled “By operator”One row per person who completed or ran a step in the period:
- Steps and Units count the steps each person completed (whoever tapped Complete step).
- Running counts the time each person ran steps, from each of their starts.
- Efficiency compares the routing’s estimate with their running time, sharing each step’s estimate between the people who ran it, by time.
A row named “No one signed in” is for steps completed with nobody signed in on a tablet, such as a manager’s Mark complete on the web.
Late now
Section titled “Late now”Each active work order past its due date, most overdue first, with its item, due date, and how many days late. Choose a work order number to open it.
How running time and efficiency work
Section titled “How running time and efficiency work”Running time is each stretch from a step’s start until the next stop, hold, or complete. Time a step sat paused or on hold doesn’t count. If an operator stops a job for lunch and starts it again afterward, only the two working stretches count.
Efficiency is the routing’s estimate divided by the actual running time:
- The estimate comes from the step’s throughput (units an hour, or minutes a unit) times the order’s quantity. Set throughputs on each item’s routing; see Routings.
- 100% means the work took exactly as long as the routing said. More than 100% is faster than the estimate, and less is slower.
- Only steps with a throughput count. A station or person with none shows a dash.
Overall equipment effectiveness (OEE)
Section titled “Overall equipment effectiveness (OEE)”
Below the chart, Overall equipment effectiveness shows four tiles for the whole shop:
- OEE: availability × performance × quality.
- Availability: the share of planned time a station wasn’t down. Planned time is its open hours less its scheduled downtime. Downtime logged on its tablet counts against it.
- Performance: pace against the routing, at most 100%.
- Quality: good units over good and scrapped units.
If a station is down now, a line says so, with a link to the live view. OEE by station gives the same numbers for each station, and Downtime by reason shows how long and how often each reason stopped the floor in the period. For how stations are marked down and how each number is worked out, see Downtime and OEE.
One location at a time
Section titled “One location at a time”With more than one location, pick a location in the header’s location switcher to see just its stations. The heading shows the location’s name (“Dashboard · North plant”), and the period’s days follow that location’s clock. See Locations.
Get it by email
Section titled “Get it by email”Admins can have the dashboard’s numbers emailed each week or month. Choose Email it weekly or monthly at the top right of the dashboard. It opens Scheduled reports in Shop settings. See Shop settings and the daily summary.